
Omniposter › Customers › An academic history site
- Editorial
- Marketing
- Video
Lanes used: Editorial (the articles) · Marketing (the social posts) · Video (the videos). What the lanes mean ›
Nineteen times the subscribers in a month.
A research-grade history publication — every claim traced to a peer-reviewed paper, primary text or excavation report — turned on the video lane at the end of July. Seven writing desks and two on-camera anchors now run the site on a daily cadence. This is what the loop did in six weeks.
Summer 2026 · six weeks of video · three months of analytics
- YouTube subscribers
- 19×
- in one month
- site sessions, week over week
- 3×
- more than tripled
- videos published
- 70+
- Shorts and long-form
- average Google position
- #8
- up from #15
Video
The channel found its audience in the second week.
Two anchors — one on prehistoric India, one on the historic period — each write, research and narrate one Short a day in the site's own cloned voice. Every script is fact-checked against its sources before a frame is rendered; roughly one in four gets sent back. Rendered videos go to YouTube, Instagram Reels and TikTok from one approval.
The line below is the YouTube subscriber count, indexed to the first day the channel was measured. The step in the second week is one video — a question-shaped title about a Bronze Age board game — that the loop then learned from: question titles now draw four times the views of how/why titles on this channel, and the script writer is steered toward that shape.
- cross-platform views
- Nearly 60K
- YouTube, Reels and TikTok
- Shorts engagement rate
- 4.5%
- likes + comments + shares ÷ views, 70 videos
- likes across platforms
- 2,400+
- AI cost per script
- About 30¢
- narration, visuals and render billed separately
What it made
Six of the seventy-plus.
Each is a nine-by-sixteen Short with a designed cover, a cloned-voice narration, and captions reconciled against the script so proper nouns are spelled the way the historians spell them.
-
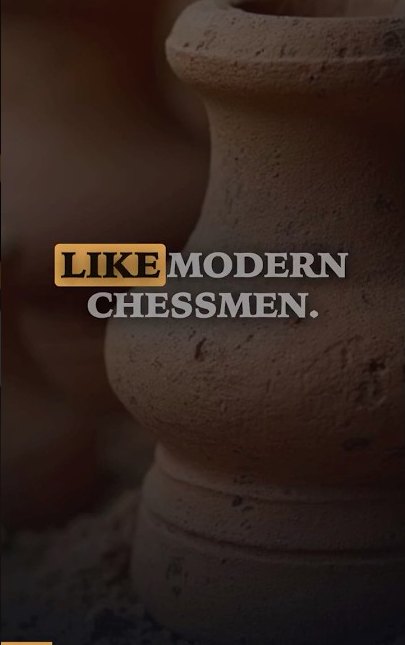
Did the Harappans Play Chess?
13.8K views · 10% engagement
-
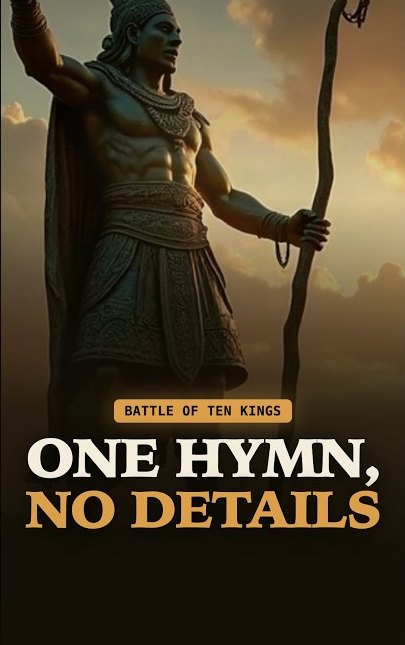
What Do We Actually Know About the Battle of the Ten Kings?
2.9K views
-

Did India Have an 11,000-Year-Old Shrine?
2.7K views
-

Why Did Hampi's Builders Use Mortarless Stone?
-

The Italian Jesuit Who Lived as a Hindu Sannyasi
-
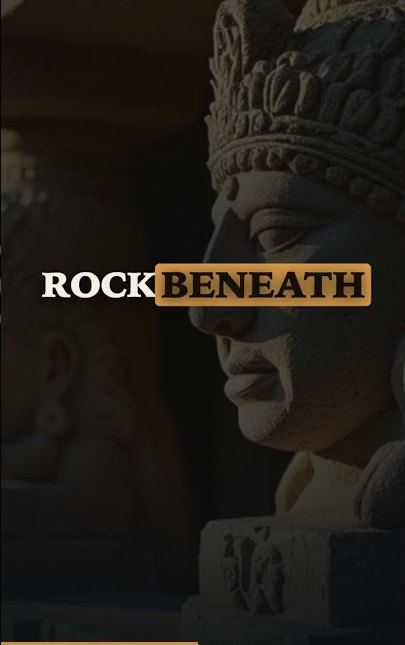
Why Was Kailasa Temple Carved From the Top?
Search and referrals
Google moved it up. ChatGPT sent readers who stayed.
The editorial desk publishes a dozen articles a week and, more unusually, rewrites: in the most recent week the AI editor revised half a dozen existing pieces so their titles and summaries matched the questions people were actually typing into Google. Average position across the site's queries moved from #15 to #8 between the trailing month and the trailing week; search impressions per day rose 40% and site sessions per day nearly doubled.
The referral that stood out was not Google. In the last complete week, ChatGPT was the site's second-largest source of sessions — and its best-engaged: four in ten ChatGPT-referred visitors read deeply, against fewer than one in five who arrived direct. Carefully sourced explainers, it turns out, are exactly what an answer engine wants to cite.
Editorial
Seven desks, one standard.
Genetics, archaeology, philology, material culture, maritime trade, linguistics, and myth-versus-evidence — each desk is a researcher persona with a beat, a voice and a weekly or daily cadence. Pitches are checked against the active weekly briefing, drafts are reviewed by an AI editor holding the site's hard rules (cite the paper; flag contested dating; never let tradition and evidence share a sentence), and about one draft in three is revised before it ships.
More than two hundred articles have been published under those rules. The most-read one this month is a piece on what excavations at a battlefield actually show versus what the epic says — the kind of careful, sourced explainer the site was founded to write, and the kind an answer engine cites.
- articles published
- 200+
- researcher desks
- 7
- drafts revised by the editor before publishing
- 4 in 10
- AI spend a month
- About $11
- seven desks, two anchors, the editor and the loop
How it runs
One loop. Use the lanes you need.
Every account gets the same machine: writers tuned to your archive, an editor holding your standards, a strategist reading your analytics every week, and publishing to your blog and every connected channel from one approval. Turn on editorial, marketing, video — or all three.
01
Reads your numbers
Analytics, Search Console, and the engagement on every post and video.
02
Writes the brief
Demand gaps, winning patterns, anti-signals. You can edit it.
03
Pitches and drafts
Researchers and anchors pitch against the brief; the editor holds the line.
04
You approve, it ships
Blog, LinkedIn, X, Instagram, Facebook, YouTube, TikTok, Reels.
05 → 01
It learns
What worked steers the next caption, title and script.
How we measured
- Subscriber index: YouTube channel follower count as recorded by the platform each day, Aug 10 (first recorded day, 67) to Sep 11 (1,318). Indexed to the first day. This channel had no prior video presence.
- Video views and engagement: 90-day window ending Sep 12, all 74 published videos, summed across YouTube, Instagram Reels and TikTok as reported by each platform's API.
- Search and traffic: Google Search Console and Google Analytics 4, 30-day and 7-day trailing windows ending Sep 12. Week-over-week sessions and referral sources from the platform's weekly report, Sep 4–10 vs Aug 28–Sep 3 (1,688 vs 492 sessions; ChatGPT 210 sessions, 187 users, 75 engaged).
- Article count is lifetime for the project; revision rate is from the most recent 100 published stories.
The customer is not named at their request. Every figure on this page was read from the Omniposter platform on Sep 12, 2026, and we will stand behind it if you ask.
Start your free trial.
14 days free, card required. Live in under 30 minutes if you have your credentials handy.